The 5 Metrics That Actually Matter

Most creators track the wrong numbers. Learn to focus on the 5 metrics that predict growth and tell you exactly what content to make more of.
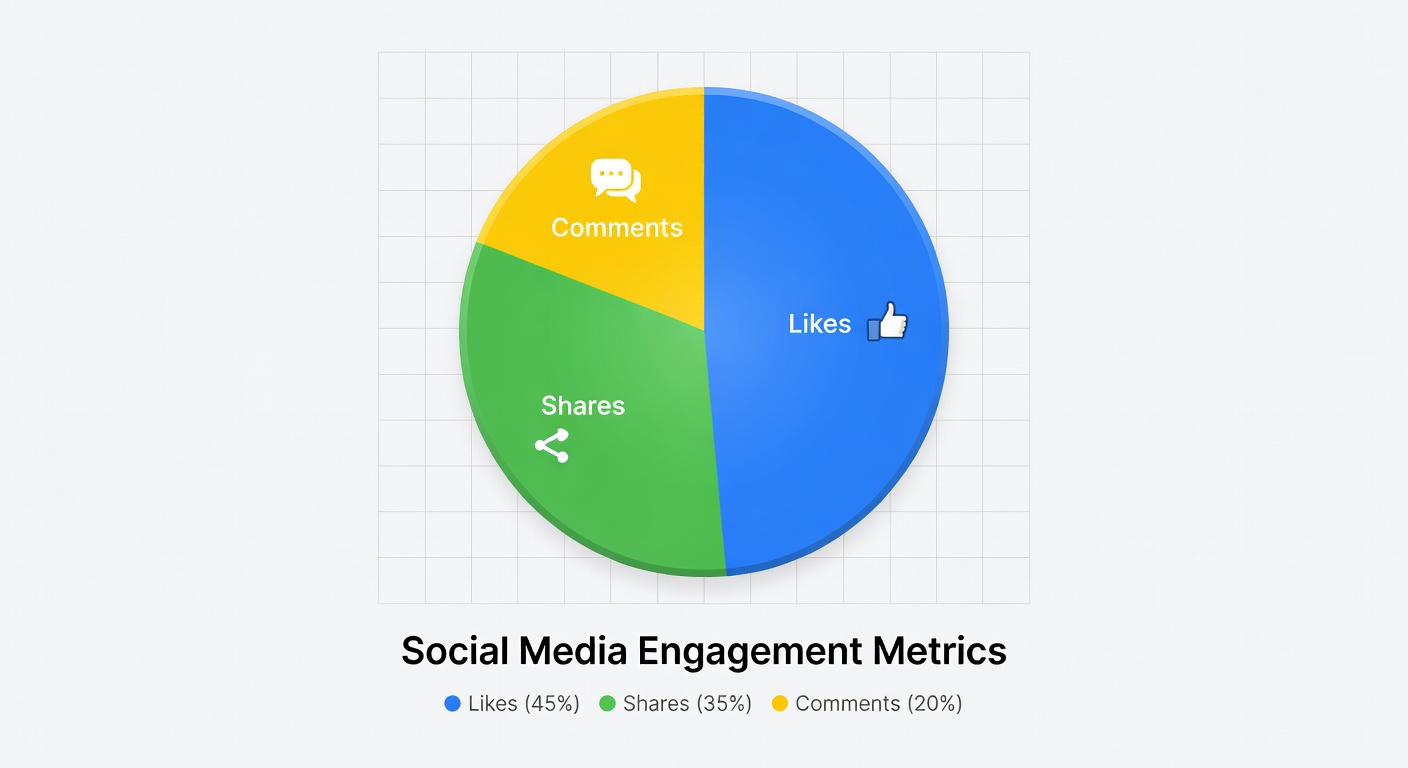
Explore Metrics
Analytics dashboard illustration

Click a Metric to Explore It

⏱️
Watch Time %
Retention
📡
Reach
Discovery
🔖
Saves
Value Signal
↗️
Shares
Virality
👤
Profile Visits
Conversion
⏱️
Watch Time % (Average View Duration)
The single most important metric for short-form video on every platform

Why It Matters

Watch time percentage tells the algorithm how many people watched your video all the way through. A high % signals that your content is worth showing to more people — this is the core distribution driver on TikTok, Instagram Reels, and YouTube Shorts.

How to Improve It

  • Make the hook your best work — first 2 seconds set the watch time ceiling
  • Use pattern interrupts every 5–7 seconds to reset attention
  • Loop your video — last frame leads back to first for rewatches
  • Remove all "dead air" or slow-talking parts during editing

Watch Time Formula

Watch Time % = Total Watch Time ÷ (Views × Video Length)
Aim for 70%+ on videos under 30 seconds. 50%+ is good for 60-second videos.
Industry Benchmarks
📸 Instagram Reels65–80%
🎵 TikTok55–70%
▶️ YouTube Shorts50–65%
Warning Signs
❌ Under 30% — hook is failing
❌ Drop at 3s — intro is too slow
❌ Drop at 50% — value isn't delivered
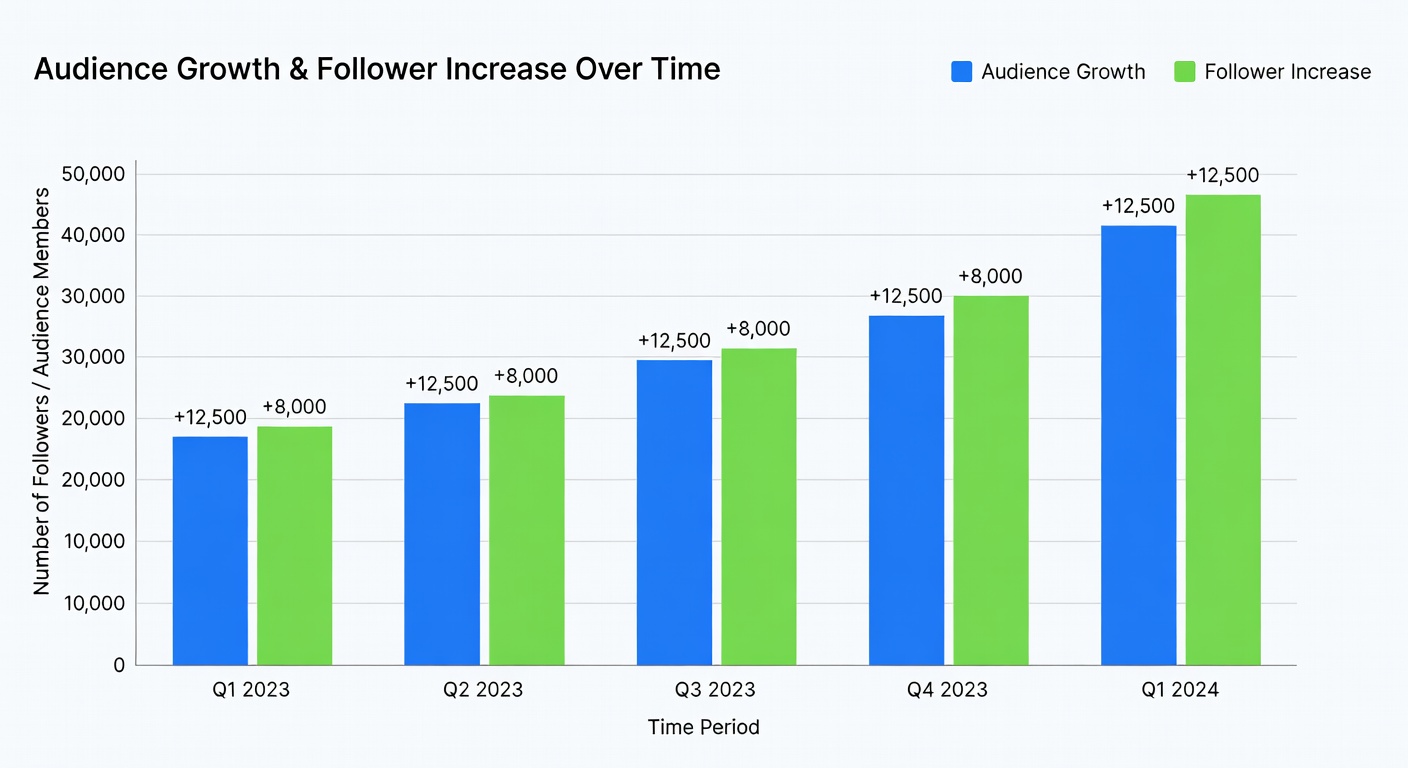
Audience growth analytics

The 10-Minute Weekly Analytics Habit

You don't need to spend hours in analytics. You need one 10-minute session every week reviewing the right numbers.
1
Find your top-performing post (2 min)
Sort by reach this week. Note the hook, format, and pillar.
2
Identify the pattern (3 min)
What did the top post do differently? Hook type, format, topic?
3
Plan one "double-down" post (5 min)
Create a new post this week that mirrors the winning pattern.
Full Analytics Guide